How Much Does HVAC Cost in Austin?
That is the modeled cost to deliver plus a fair contractor margin for hvac in Austin, not a sales quote. Built from BLS wage data, Craftsman bills of materials, and verified permit fees. 2026-07-10
Show the math
The margin is the gap between break even and a typical quote, not a markup we invent. Fair margin moves with trade and market. Most land between 18 and 28 percent over cost to deliver, and free labor does not exist. Full methodology.
Is your hvac bid fair?
Calculate your Austin true cost.
Show the math: how Austin Central HVAC System (Gas) numbers are derived Click to expand
What you pay for in Austin.
Every hvac dollar in Austin, split into labor, materials, permit, overhead, and the contractor margin. The first four are the cost to deliver. On top of that sits the margin a fair job earns.
Heat pump, furnace, or mini-split?
The three system types most Austin homes weigh, with real local install cost. Pick by your climate and whether you already have gas and ductwork.
- Heats and cools in one system
- No gas, very efficient in mild winters
- Highest upfront cost
- Leans on backup heat in deep cold
- Strong, cheap heat in hard winters
- Lower upfront than a heat pump
- Heating only, you still need AC
- Burns gas and needs venting
- No ductwork required
- Zone each room on its own
- One indoor head per zone adds up
- Wall units are visible
Austin runs 0.1 percent below the national average on central HVAC. The city average lands at $13,092, but the lowest realistic out-the-door price drops to $10,998. I built the model that pulls apart two different things: what the job actually costs to deliver, and what contractors charge you. That gap matters here more than in most towns.
Local Market
In five years Austin went from a middle-of-the-pack market to one of the pricier ones in Texas. The 2020 to 2023 population boom shot trade labor demand through the roof. BLS base wage here runs $30.74 per hour (TFB Cost Index, 2026). Tack on the 37.83 percent burden and your loaded rate hits $42.37 per hour. That lines up with the 22 Craftsman hours we figure for a full central gas system. Materials sit at $6,043 after FRED PPI adjustments, and the permit stays cheap at $67. Even so, the city average climbs to $13,092. Builders tell me the tech sector siphoned skilled guys off into other jobs, which nudged local wages 10 to 15 percent above the Texas average. Once the building permit pace fell from 4,000 a month down to 1,800, contractors never walked their pricing back. Cost to Deliver works out to $9,655 before anybody adds a dime of margin. That leaves real daylight between the floor and the average bid.
Austin grew too fast for the trades to keep up. That $42.37 loaded wage tells me the good guys are still in demand. 26.2 percent margin on a $13,092 job is honest money in a hot market. But some bids I see are pure gravy. Take the fair one and pay the man before he finds easier work.
Understanding Your Bid
Not every $14,737 bid is gouging (TFB Cost Index, 2026). Some get close, though. The lowest realistic price of $10,998 is the leanest price the model supports locally. Our model pegs Cost to Deliver at $9,655, and that covers burdened labor, materials, the $67 permit, and the $2,613 overhead allocation. The 26.2 percent contractor margin lives in the space between the $13,092 average and true delivery cost. Against the floor, you could save $2,094. Bids come in 30 percent over the floor with the scope completely unchanged. The lead gen sites never show you any of this math. They just farm the lead and move on. Take whatever quote shows up and run it through the Bid Fairness Checker on this page. It'll tell you in a hurry whether the numbers match what we actually see in Austin.
Cost Breakdown
Pull the central HVAC number apart and it gets easy to read. Labor runs 22 Craftsman hours at the loaded BLS rate of $42.37 per hour (Craftsman, 2026), which comes to $932 in burdened labor. Materials add $6,043 off the latest FRED PPI input. PermitCalculator holds the permit fee flat at $67. Stack those and direct costs hit $7,042. Then we drop in $2,613 of overhead using NAHB benchmarks, and Cost to Deliver lands at exactly $9,655. Everything above that line is margin, plain and simple. So the average bid of $13,092 is carrying 26.2 percent contractor margin. The high bid at $14,737 stretches that margin even wider. Set those against the lowest likely estimate of $10,998 and the picture sharpens. No contractor needs the full overhead load on every single job. Just know where the fat's hiding before you put a pen to anything.
22 hours at that loaded rate plus $6,043 in equipment looks right for a gas system. I brazed plenty of line sets through Missouri summers. The $67 permit is nothing. That $2,613 overhead is what it takes to keep the truck running and the insurance paid. Anything under $10,998 on this scope makes me wonder which corners they're planning to cut.
How to Negotiate
Shop your HVAC job in the slow months around here. Late July through early September drags on exterior work, since nobody's thrilled to be out in 100 plus degree heat. That window hands you some pull on scheduling. Get the $9,655 Cost to Deliver number in your head first, then look at the floor of $10,998. Before you call the contractor back, push your specific bid through the True Cost Calculator or the Bid Fairness Checker. Ask him to walk you through his labor hours and where he buys material. A fair bid will explain why it sits where it does between $10,998 and $13,092. Lean too hard toward the absolute floor and your good crews just walk. But you don't have to grab the first number that hits your inbox anymore.
Don't pick up the phone in July when it's 105 and your AC just quit. Book it in spring or fall when crews actually need the work. Show them you know the $9,655 delivery number. The honest ones will walk you through their bid. The rest go quiet the second you ask real questions about material costs.
What Makes This Market Different
Austin used to be a cheaper place to build in Texas. Then it wasn't. Median home values now sit at $555,300, household income hits $93,658, and there's no state tax on top. Contractors caught on that they could charge coastal-level markups and still keep the phone ringing. The boom that drove wages up never really corrected on the pricing side once permits slowed. Heritage tree rules and impervious cover limits in the central neighborhoods pile on real money any time a job touches grading or drainage. A suburban replacement might slip through for $10,998. Move that same system two miles toward downtown and it can jump several thousand dollars on site plan changes alone. Our model reads that spread better than any lead gen average. The data says Austin homeowners are still paying for growth that already cooled off. Most of them never see the receipts.
Frequently Asked Questions
How much does central hvac system (gas) cost in Austin?
What's the cost to install central air in Austin?
How much does furnace replacement cost in Austin?
Why are HVAC bids so different in central Austin versus the suburbs?
TheFatBook models hvac from Craftsman labor hours, BLS regional wages, burden, PPI-adjusted materials, permit data where available, and contractor overhead benchmarks. Cost index version: 2026-07-10. Updated Jul 2026.
Sources & methodology for these numbers
- Independent FatBook v3 cost index for HVAC in Austin.
- BLS OEWS wage inputs (https://www.bls.gov/oes/) and FRED PPI material inflation (https://fred.stlouisfed.org/) references.
- Craftsman labor-hour references and contractor overhead benchmarks.
- Verified permit/source data from PermitCalculator.com and permits_compiled where available.
What the hvac in austin benchmark includes.
- Central HVAC System (Gas) as the headline cost-index scope
- labor-hour assumptions, regional wage inputs, materials, overhead, and permit data where available
- low, average, high, lowest realistic price, margin, and savings benchmarks from the FatBook cost index
- hidden damage, change orders, emergency service premiums, or unusual site access conditions
- contractor financing approval, warranties, provider recommendations, or guaranteed final quotes
- permit rulings for a specific address unless the city permit panel lists verified local data
Embed this chart on your site (free, with attribution)
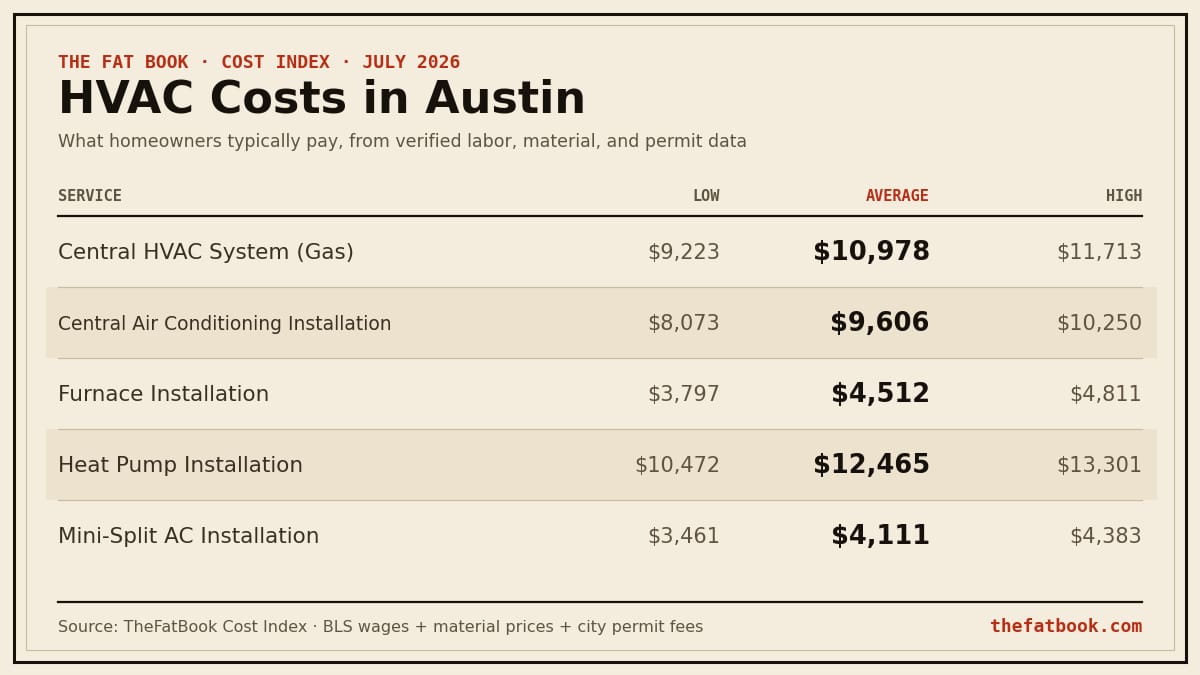
| Service | Low | Average | High |
|---|---|---|---|
| Central Air Conditioning Installation | $9,662 | $11,500 | $12,944 |
| Furnace Installation | $3,789 | $4,502 | $5,062 |
| Mini-Split AC Installation | $3,461 | $4,111 | $4,622 |
| Heat Pump Installation | $12,262 | $14,598 | $16,434 |
| Central HVAC System (Gas) | $10,998 | $13,092 | $14,737 |
| Mini-Split Heat Pump Installation | $3,461 | $4,111 | $4,622 |
| Remove Heating System | $261 | $311 | $350 |
| Baseboard Heater Installation | $969 | $1,141 | $1,277 |
| Gas Wall Furnace Installation | $2,338 | $2,773 | $3,115 |
| Humidifier Installation | $931 | $1,097 | $1,227 |
| Hydronic Heating Installation | $9,879 | $11,759 | $13,235 |
| Ductwork Installation | $6,776 | $8,052 | $9,055 |
| Insulation Removal | $288 | $325 | $372 |
| Attic Insulation Installation | $2,232 | $2,659 | $2,995 |
Austin permits.
$12k building fee: $370
$25k building fee: $370
Electrical base: $167
Plumbing base: $67
HVAC base: $67
Source-backed permit facts from PermitCalculator.com and the underlying permits_compiled dataset. Always confirm final requirements with the local building department before filing.
Got a bid? We'll check it.
Payment options.
Also in Austin: 5 other trades
Find a Contractor
Need a hvac pro in Austin? Browse verified Austin contractors in the Better Builders Network, checked on license history and reviews. Certified Partners are verified on an active license and real reviews.