
How Much Does HVAC Cost in Nashville?
This price is for a standard AC Replacement in Nashville. See other HVAC service prices ↓
That is the modeled cost to deliver plus a fair contractor margin, not a sales quote. Built from BLS metro wages, Craftsman labor hours, a real bill of materials, and hand-verified permit data. 2026-08-28
This is a central AC installation: a new condenser, coil, and lineset that reuse your existing furnace blower and ducts. It is cooling only, not a whole new system. Replacing the furnace and AC together as one gas system is the step up, a furnace-only swap the step down, and major duct rework is priced on its own.
Show the math
The margin is the gap between break even and a typical quote, not a markup we invent. Fair margin moves with trade and market. Most land at a 15 to 22 percent margin on the bid, roughly 18 to 28 percent over the cost to deliver, and free labor does not exist. Full methodology.
Is your HVAC bid fair?
Calculate your Nashville true cost.
Show the math: how Nashville Central Air Conditioning Installation numbers are derived Click to expand
What you pay for in Nashville.
Every HVAC dollar in Nashville, split into labor, materials, permit, overhead, and the contractor margin. The first four are the cost to deliver. On top of that sits the margin a fair job earns.
See cost by project size
What central air conditioning installation costs at your size.
Priced at the standard ton sizes. Pick the one that matches your system.
| Size | Typical | Range |
|---|---|---|
| 2 ton | $6,899 | $6,455 to $7,635 |
| 3 ton | $9,517 | $8,904 to $10,532 |
| 5 ton | $12,282 | $11,491 to $13,591 |
Scaled from TheFatBook's per-size cost model, the same one behind the calculator.
Heat pump, furnace, or mini-split?
The three system types most Nashville homes weigh, with real local install cost. Pick by your climate and whether you already have gas and ductwork.
- Heats and cools in one system
- No gas, very efficient in mild winters
- Highest upfront cost
- Leans on backup heat in deep cold
- Strong, cheap heat in hard winters
- Lower upfront than a heat pump
- Heating only, you still need AC
- Burns gas and needs venting
- No ductwork required
- Zone each room on its own
- One indoor head per zone adds up
- Wall units are visible
Nashville sits 4.7 percent below the national average for HVAC work. That puts the typical central AC installation at $9,517 while the lowest realistic price lands at $8,904. Most homeowners still pay more than they need to because bids hide the real delivery cost. I built TheFatBook Cost Index on actual local wages and tracked material prices so you can see the difference before you sign anything.
Numbers on this page come from Craftsman labor hours, BLS OES May 2025 wages for Nashville, FRED material prices, and the verified local permit fee. Population, income, home values and housing age come from the U.S. Census Bureau (QuickFacts and the American Community Survey); unemployment from the BLS Local Area Unemployment Statistics; building permits from the Census Bureau via FRED. How we calculate
Local Market
Nashville has grown a moderate 4.6 percent since 2020 and carries a median home value of $413,600 (U.S. Census Bureau QuickFacts). That places it between cheaper Midwest markets and the brutal coastal ones. Short term rental conversions from Airbnb investors pull labor away from regular homeowners. That lifts prices on cosmetic work including HVAC upgrades. Our data shows the city average for a central AC installation at $9,517. The cost to deliver sits at $7,778 which includes 27.5 craftsman hours at the loaded rate of $40.51 per hour from BLS OEWS wage input. Materials add $5,093 after FRED PPI adjustment. Overhead eats another $1,496 per NAHB benchmarks. The permit stays cheap at just $75 through PermitCalculator data. This mix of steady 4.6 percent population growth and moderate labor competition explains why Nashville avoids the extreme shortages seen in faster metros. But it still carries a 18.3 percent contractor margin on average bids.
That eighteen percent margin tells me Nashville contractors are doing alright but not getting fat. With about five percent population growth and all those Airbnb houses pulling labor I'd have expected higher. The seventy five dollar permit is a nice break too. Take a bid near about ten thousand to the bank if the guy seems solid.
Understanding Your Bid
Look at a $10,532 quote for a central AC installation and the first question should be whether that's fair. The cost to deliver comes in at $7,778 according to TheFatBook Cost Index. That leaves a 18.3 percent contractor margin between delivery cost and the city average. Yet the verified floor means you have $613 of potential savings between average and lowest realistic price. Not every bid above that floor is a ripoff. Some contractors earn that margin through tight scheduling and real accountability. Others pad it because homeowners don't know the numbers. It'll tell you in plain terms where your quote lands against the true cost data for Nashville.
Check your bid against these numbers →
Cost Breakdown
Break down the central AC installation and the numbers get mechanical fast. Labor takes 27.5 hours at the loaded wage of $40.51 per hour which already folds in the 37.8 percent burden on top of the $29.39 base from BLS OEWS wage input (Craftsman, 2026). That produces $1,114 in total labor cost. Materials run $5,093 after the latest FRED PPI adjustment for equipment and components. The permit fee is a flat $75 from PermitCalculator data. Overhead allocation adds $1,496 per NAHB benchmarks for insurance, trucks, and office costs. Those pieces add to the cost to deliver of $7,778. Everything above that line represents the contractor margin. The verified floor reflects the leanest sustainable price in this market. The spread is worth a look because Nashville labor costs track closely with national figures. Yet material inputs show less volatility than tornado alley cities further west.
twenty seven and a half hours sounds about right for a full central air system. I've done plenty of those. About fifty one hundred in materials lines up with what supply houses charge when you aren't paying retail markup. Labor at forty one dollars loaded per hour matches what my crews cost me back in the day. Looks clean.
How to Negotiate
Shop your HVAC job in the shoulder months here. Avoid the peak summer replacement rush when flash flooding concerns and cooling emergencies compress schedules and weaken your leverage. Get bids in March or October when contractors hunt for steady work instead of emergency calls. All the same, moderate growth, 4.6 percent since 2020, means crews stay busy but not overwhelmed. Know the $8,904 floor before you sit down with any contractor. It isn't a number to throw in their face. It's your benchmark for what a lean efficient outfit can defensibly charge. Then ask the contractor to walk you through his material sourcing and crew hours. Good ones will explain it. That conversation alone often trims hundreds off the final number without killing their ability to do the job right.
Don't wait until your AC dies in July. Shoulder months work better here because the crews aren't slammed. Tell them you've checked the numbers and you expect a fair price near the floor. Guys who want the work will sharpen their pencil. The ones who won't were never worth it anyway.
Price your own job in Nashville →
What Makes This Market Different
What really sets Nashville HVAC pricing apart is the Airbnb effect. Short term rental investors convert older 1987-era houses into cash flow machines and they compete head on with homeowners for the same HVAC crews. That pushes the city average to $9,517 even though the underlying BLS wage input and 27.5 craftsman hours look reasonable. The permit fee stays a bargain at $75 which is roughly one third what similar work costs in tighter regulated cities. Yet the steady 4.6 percent population growth plus that vacation rental demand keeps contractors selective. I watched how TheFatBook Cost Index reacted to these inputs. The 18.3 percent margin feels earned in a market where crews can pick between a quick investor flip or a detailed owner occupied install. The lowest realistic price still gives homeowners a fighting chance if they refuse to accept the first bid that shows up. Plain and simple. Most cities don't have this exact tension between tourism driven conversions and normal residential work.
Frequently Asked Questions
How much does central AC installation cost in Nashville?
Is my HVAC bid fair in Nashville?
How much does a heat pump installation cost in Nashville?
Why do Nashville HVAC prices differ from national averages?
TheFatBook models HVAC from Craftsman labor hours, BLS regional wages, burden, PPI-adjusted materials, permit data where available, and contractor overhead benchmarks. Cost index version: 2026-08-28. Updated Aug 2026.
Sources & methodology for these numbers
- Independent FatBook v3 cost index for HVAC in Nashville.
- BLS OEWS wage inputs (https://www.bls.gov/oes/) and FRED PPI material inflation (https://fred.stlouisfed.org/) references.
- Craftsman labor-hour references and contractor overhead benchmarks.
- Verified permit/source data from PermitCalculator.com and permits_compiled where available.
What the HVAC in nashville benchmark includes.
- Central Air Conditioning Installation as the headline cost-index scope
- labor-hour assumptions, regional wage inputs, materials, overhead, and permit data where available
- low, average, high, lowest realistic price, margin, and savings benchmarks from the FatBook cost index
- hidden damage, change orders, emergency service premiums, or unusual site access conditions
- contractor financing approval, warranties, provider recommendations, or guaranteed final quotes
- permit rulings for a specific address unless the city permit panel lists verified local data
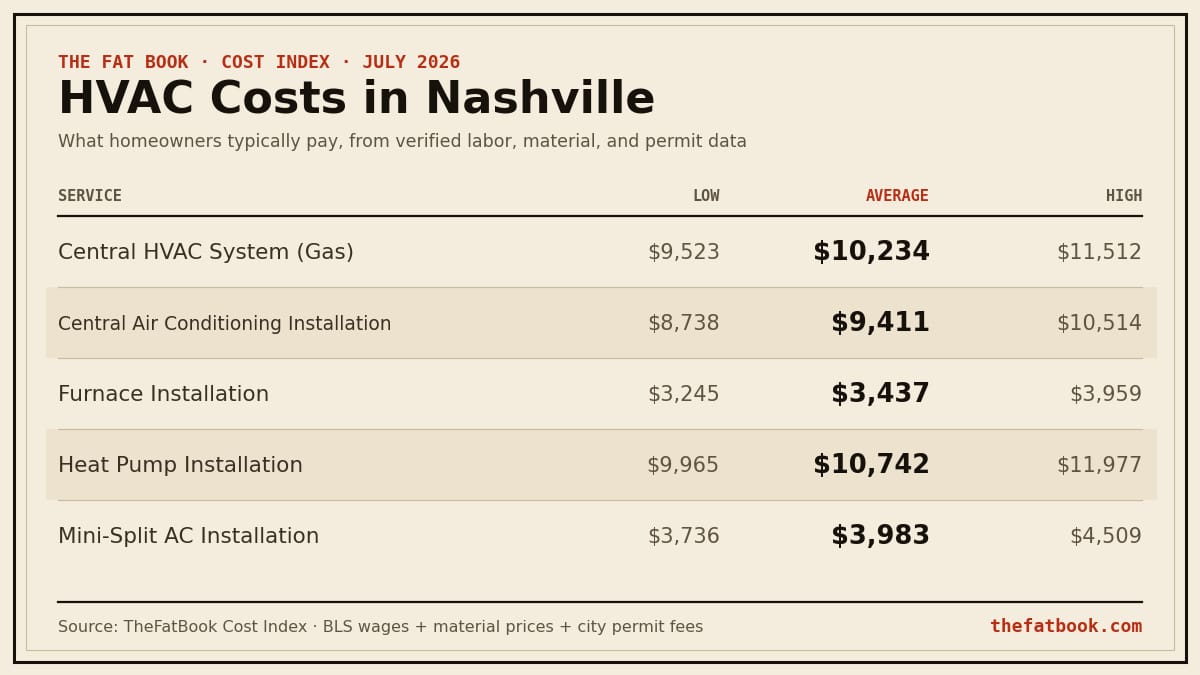
Embed this chart on your site (free, with attribution)
| Service | Low | Average | High |
|---|---|---|---|
| Central Air Conditioning Installation · 3 ton | $8,904 | $9,517 | $10,532 |
| Add AC to Existing Furnace | $8,008 | $8,549 | $9,133 |
| Furnace Installation | $3,329 | $3,503 | $3,966 |
| Mini-Split AC Installation · 1 ton | $3,821 | $4,046 | $4,512 |
| Heat Pump Installation · 3 ton | $10,151 | $10,858 | $11,987 |
| Central HVAC System (Gas) | $10,600 | $11,260 | $11,971 |
| Mini-Split Heat Pump Installation · 1 ton | $3,821 | $4,046 | $4,512 |
| Remove Heating System | $261 | $296 | $334 |
| Baseboard Heater Installation | $700 | $776 | $858 |
| Gas Wall Furnace Installation | $2,327 | $2,472 | $2,629 |
| Hydronic Heating Installation | $10,420 | $10,878 | $12,775 |
| Ductwork Installation | $9,150 | $10,377 | $11,698 |
| Attic Insulation Installation · 1,000 sqft | $2,175 | $2,468 | $2,785 |
| Fiberglass Batt Insulation · 1,000 sqft | $2,436 | $2,765 | $3,120 |
| Blown-In Insulation · 1,000 sqft | $1,866 | $2,118 | $2,390 |
| Rigid Foam Insulation · 200 sqft | $698 | $792 | $894 |
| Whole-House ERV/HRV Installation | $2,673 | $2,845 | $3,114 |
| AC Repair | $237 | $269 | $303 |
| Furnace Repair | $237 | $269 | $303 |
| Multi-Zone Mini-Split Installation | $5,510 | $5,797 | $6,622 |
| Spray Foam Insulation · 1,000 sqft | $2,666 | $3,026 | $3,414 |
| Boiler Installation | $4,357 | $4,629 | $5,150 |
| Whole-House Dehumidifier Installation | $2,326 | $2,435 | $2,732 |
| Wood Stove Installation | $3,539 | $3,725 | $4,223 |
| Pellet Stove Installation | $3,285 | $3,453 | $3,848 |
| Gas Fireplace Installation | $3,104 | $3,264 | $3,697 |
| Chimney Liner Installation | $2,819 | $2,979 | $3,224 |
Before you get bids in Nashville.
Nashville permits.
$12k building fee: $91
$25k building fee: $163
Electrical base: $75
Plumbing base: $75
HVAC base: $75
Source-backed permit facts from PermitCalculator.com and the underlying permits_compiled dataset. Always confirm final requirements with the local building department before filing.