
How Much Does Kitchen Remodeling Cost in Richmond?
This price is for a standard Kitchen Remodel in Richmond. See other kitchen remodeling service prices ↓
That is the modeled cost to deliver plus a fair contractor margin, not a sales quote. Built from BLS metro wages, Craftsman labor hours, a real bill of materials, and hand-verified permit data. 2026-08-28
Mid-range here means the remodel most people actually buy: new cabinets, counters, sink, appliances, and floors in the layout you already have. The money goes into cabinets and stone, not into moving walls. The full gut with layout changes is the premium tier.
Show the math
The margin is the gap between break even and a typical quote, not a markup we invent. A fair margin floats by trade and market, most landing at a 15 to 22 percent margin on the bid, about 18 to 28 percent over the cost to deliver, and nobody works for free. Full methodology.
Is your kitchen remodeling bid fair?
Calculate your Richmond true cost.
Show the math: how Richmond Kitchen Remodel (Combined) numbers are derived Click to expand
What you pay for in Richmond.
Every kitchen remodeling dollar in Richmond, split into labor, materials, permit, overhead, and the contractor margin. The first four are the cost to deliver. Margin is the earned part on top.

See kitchen remodeling cost by grade (budget, mid, premium)
Budget, mid, or premium?
The same kitchen remodeling in Richmond at three build levels. Pick the row that matches your scope.
| Grade | What it covers | Typical | Range |
|---|---|---|---|
| Budget | Cosmetic refresh: reface or refinish, stock fixtures, keep the existing layout. | $12,471 | $11,250 to $13,787 |
| Mid-RangeMost common | Full replacement with mid-grade materials on the same footprint. | $29,078 | $26,223 to $32,152 |
| Premium | Custom work, high-end finishes, and layout or structural changes. | $82,099 | $74,028 to $90,789 |
Tier prices are the Richmond cost-index numbers for each build level, same source as the headline.
Countertop materials, compared
The four countertop materials most Richmond kitchens choose between, with real local install cost. Granite and quartz dominate mid and high builds; laminate wins on price.
- Natural stone, every slab unique
- Handles heat and knives well
- Needs resealing every year or two
- Can chip at the edges
- Non-porous, never needs sealing
- Consistent color and pattern
- Costs more than granite
- Use trivets, less heat-tolerant
- Seamless joins and integrated sinks
- Scratches sand right out
- Scorches and scratches easier
- Reads less premium at resale
- The lowest upfront cost
- Hundreds of looks, fast install
- Not heat or scratch proof
- Dated feel in a high-end kitchen
Richmond kitchen remodeling runs about 9.4 percent below the national average. That average price lands at $29,078 while the lowest realistic price comes in at $26,223. I built the index from BLS wage and Craftsman labor data that pulls these numbers straight from Craftsman hours, BLS wages, FRED material trends and verified permit data. This page shows you exactly where bids land in this market and how to tell a fair one from one with fat built in.
Numbers on this page come from Craftsman labor hours, BLS OES May 2025 wages for Richmond, FRED material prices, and the verified local permit fee. Population, income, home values and housing age come from the U.S. Census Bureau (QuickFacts and the American Community Survey); unemployment from the BLS Local Area Unemployment Statistics; building permits from the Census Bureau via FRED. How we calculate
Local Market
Richmond sits on housing stock with a median build year of 1959. That age brings surprises during a kitchen remodel. Many homes still carry galvanized pipes that need replacement before modern plumbing goes in. Our data shows the combined kitchen remodel carries 120 craftsman hours at a loaded wage of $37.01 per hour (TheFatBook cost index, 2026). Materials add $12,788 after FRED PPI adjustment. Yet the permit runs just $232 here. Overhead allocation hits $6,566 per NAHB benchmarks. All that produces a cost to deliver of $24,027. The city average of $29,078 therefore leaves an 17.4 percent contractor margin. Population growth of 4.7 percent since 2020 keeps contractor demand steady but not crazy. Historic overlays in neighborhoods like The Fan add review time that pushes schedules longer than in newer suburbs. Virginia's independent city setup means Richmond permitting stays separate from Henrico or Chesterfield counties. Drive fifteen minutes and the fee or inspection rules can flip. The numbers reflect that mix of old houses and layered rules.
Eighteen and a half percent margin in this market doesn't shock me. With homes built around 1959 you hit surprises almost every time you open a wall. about five percent growth and steady demand. Good crews stay busy. The $232 permit sounds right for Richmond but the hidden pipe work pushes real cost higher than folks expect.
Understanding Your Bid
Not every kitchen remodeling bid in Richmond makes sense. The average quote sits at $29,078 (TheFatBook cost index, 2026). Yet the cost to deliver that same job lands at $24,027. That gap equals an 17.4 percent contractor margin. The lowest realistic price sits at $26,223. Between the average and that floor lives $2,855 in potential savings. I look at bids that come in above the $32,152 high end and wonder what exactly justifies it. Some contractors load extra for the older homes here. Others just price high because the market lets them. Run the numbers before you sign anything. Plenty of bids carry comfortable padding. Some carry too much.
Check your bid against these numbers →
Cost Breakdown
Labor takes 120 hours on a typical combined kitchen remodel here. At the loaded wage of $37.01 that equals $4,441 in burdened labor cost (Craftsman, 2026). The base BLS wage is $27.14 per hour. Add the 36.4 percent burden for taxes, insurance and benefits and you reach the full loaded rate. Materials run $12,788 once FRED PPI adjustments are applied. The permit fee adds $232 from PermitCalculator data. Overhead allocation comes to $6,566 per NAHB benchmarks. Add it all up and the cost to deliver reaches $24,027. Everything above that figure is margin. The floor price of $26,223 represents the bottom of the fair band after a lean sustainable margin. Contractors who hit the floor run tight but stay viable. The city average of $29,078 leaves room that some earn through efficiency and others through markup. Check your specific scope against these line items before you compare bids.
One hundred twenty hours looks about right for a full combined kitchen. I've torn out and rebuilt plenty where the demo alone ate two days. Materials at about twelve thousand feels solid if they buy direct. The loaded rate near thirty seven an hour matches what I paid my guys in Missouri. Overhead at six thousand makes sense for a real shop that keeps trucks running.
How to Negotiate
Shop your kitchen remodel in late fall or early winter in Richmond. Mid-Atlantic winters slow exterior work and free up crews for indoor jobs like this. That timing tilts the table your way. Get bids from contractors who work the older housing stock regularly. They already know where galvanized pipe surprises hide. It shows instantly whether the quote sits near the $26,223 floor or closer to the $29,078 average. Ask the contractor to break out labor hours and material sourcing. Meanwhile, many will sharpen their pencil once they realize you know the cost to deliver sits at $24,027. Push gently on overhead if their number feels bloated. Honest contractors explain their bid. The ones who don't usually have the most to explain.
Winter is your friend in Richmond. Crews want indoor work when the ground freezes. Show them you know the twenty two thousand cost to deliver and watch the quote tighten. Don't lead with the floor price or they'll laugh you off the porch. Talk their language about the old galvanized lines and suddenly the bid gets realistic fast.
Price your own job in Richmond →
What Makes This Market Different
The Fan and other historic districts turn kitchen remodeling into a longer game in Richmond. Architectural review boards can reject cabinet styles or countertop edges that'd slide through without comment in newer parts of town. That stretches timelines and sometimes forces material changes that add cost. Our index already folds some of that friction into the numbers yet the effect still shows up in the spread between $26,223 and $32,152. Point taken. Median home values sit at $353,000 while household income averages $59,606. That combination means many homeowners treat the kitchen as their biggest single investment. They want it right. Yet the 1959 median build year means almost every project bumps into outdated plumbing or wiring that the original builders never imagined would need upgrading. Pause on that. I found the $232 permit fee surprisingly low given the review layers. It tells me inspectors focus on safety rather than design. The data also shows labor hours at 120 for the combined job. That feels honest for a city where crews regularly open walls that haven't been touched since the Eisenhower administration. Other cities with newer stock simply don't carry the same hidden work. Richmond kitchens therefore cost what they cost for reasons you won't find duplicated anywhere else.
Frequently Asked Questions
How much does kitchen remodel (combined) cost in Richmond?
Is my kitchen remodeling bid fair in Richmond?
What's included in the $29,078 average kitchen remodeling cost in Richmond?
How do historic district rules affect kitchen remodeling costs in Richmond?
The kitchen remodeling figure is built from parts, never scraped: published labor hours, this metro's wages with burden, current material prices, permit data where available, and overhead a working shop actually carries. Cost index version: 2026-08-28. Updated Aug 2026.
Sources & methodology for these numbers
- Independent FatBook v3 cost index for Kitchen Remodeling in Richmond.
- BLS OEWS wage inputs (https://www.bls.gov/oes/) and FRED PPI material inflation (https://fred.stlouisfed.org/) references.
- Craftsman labor-hour references and contractor overhead benchmarks.
- Verified permit/source data from PermitCalculator.com and permits_compiled where available.
What the kitchen remodeling in richmond benchmark includes.
- Kitchen Remodel (Combined) as the headline cost-index scope
- labor-hour assumptions, regional wage inputs, materials, overhead, and permit data where available
- low, average, high, lowest realistic price, margin, and savings benchmarks from the FatBook cost index
- hidden damage, change orders, emergency service premiums, or unusual site access conditions
- contractor financing approval, warranties, provider recommendations, or guaranteed final quotes
- permit rulings for a specific address unless the city permit panel lists verified local data
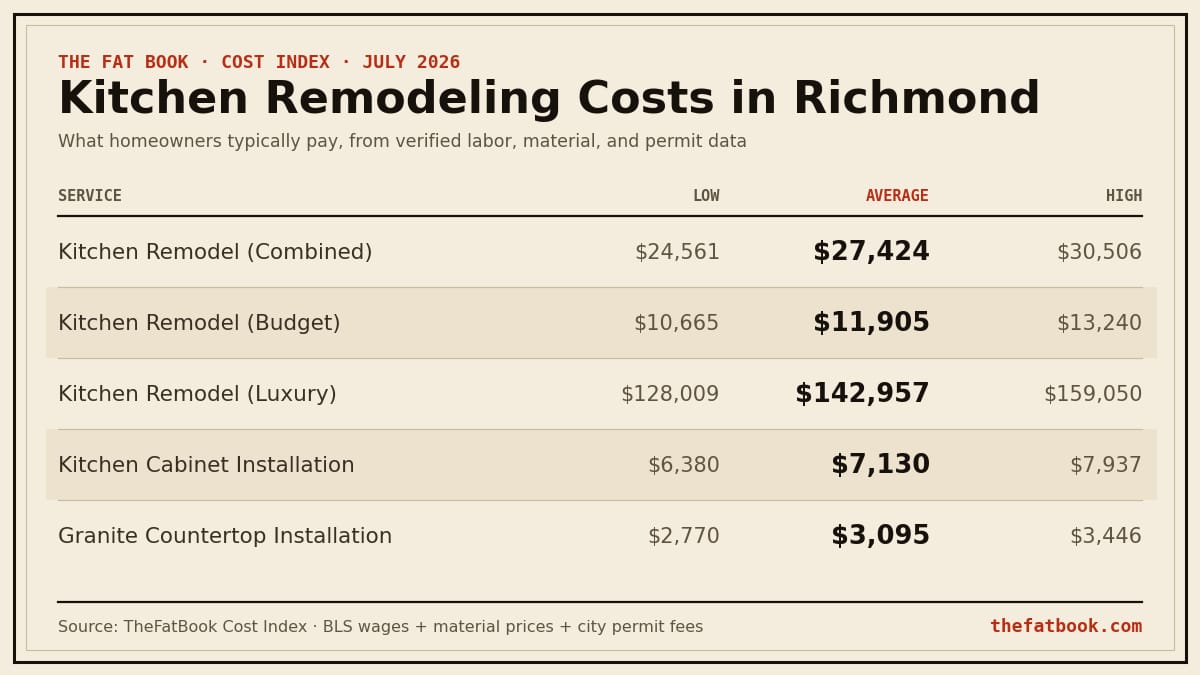
Embed this chart on your site (free, with attribution)
| Service | Low | Average | High |
|---|---|---|---|
| Install Hardwood Floor · 350 sqft | $5,178 | $5,678 | $6,217 |
| Laminate Flooring · 350 sqft | $3,197 | $3,506 | $3,839 |
| Install Tile Floor · 125 sqft | $2,373 | $2,602 | $2,849 |
| Kitchen Cabinet Installation · 40 linear ft | $6,844 | $7,596 | $8,405 |
| Kitchen Remodel (Budget) | $11,250 | $12,471 | $13,787 |
| Kitchen Remodel (Mid-Range) | $26,223 | $29,078 | $32,152 |
| Kitchen Remodel (Premium) | $74,028 | $82,099 | $90,789 |
| Kitchen Remodel (Luxury) | $137,820 | $152,852 | $169,035 |
| Kitchen Demolition | $1,733 | $1,903 | $2,086 |
| Kitchen Faucet Installation | $422 | $468 | $518 |
| Kitchen Sink Installation | $709 | $787 | $871 |
| Garbage Disposer Installation | $485 | $538 | $596 |
| Dishwasher Installation | $1,278 | $1,418 | $1,570 |
| Range Hood Installation | $616 | $684 | $757 |
| Microwave Installation | $606 | $673 | $787 |
| Wall Oven Installation | $1,942 | $2,155 | $2,507 |
| Granite Countertop Installation · 20 linear ft | $2,800 | $3,107 | $3,438 |
| Quartz Countertop Installation | $3,800 | $4,217 | $4,667 |
| Laminate Countertop Installation · 20 linear ft | $1,778 | $1,974 | $2,184 |
| Vinyl Plank Flooring Installation · 350 sqft | $3,200 | $3,509 | $3,841 |
| Cabinet Refacing | $6,496 | $7,209 | $7,978 |
| Tile Backsplash Installation · 30 sqft | $929 | $1,031 | $1,141 |
| Range Installation | $1,342 | $1,374 | $1,701 |
| Butcher Block Countertop | $3,129 | $3,473 | $3,843 |
| Marble Countertop Installation | $4,742 | $5,263 | $5,824 |
Before you get bids in Richmond.
Richmond permits.
$12k building fee: $126
$25k building fee: $207
Electrical base: $70
Plumbing base: $70
HVAC base: $101
Source-backed permit facts from PermitCalculator.com and the underlying permits_compiled dataset. Always confirm final requirements with the local building department before filing.